A
Approved artifacts
Aggregate figures and presentations are preserved unchanged as public historical outputs.
Approved public research summary · Signal processing
Approved aggregate result artifacts from historical TMS research, presented alongside a strictly separate synthetic MATLAB demo of wrapped phase differences and circular statistics.
01 · Evidence boundary
The gallery documents historically reported exploratory outputs. The executable demo tests general circular-phase math on synthetic signals and is not their source or validation.
Aggregate figures and presentations are preserved unchanged as public historical outputs.
Raw data and original employer code are unavailable, so the reported values are not rerun here.
Independent MATLAB code demonstrates robust circular math with generated, known inputs only.
02 · Approved public results
These aggregate visuals are approved for public presentation. Exact values are transcribed from the preserved artifacts, not independently recomputed by this repository.
Scope note. These figures preserve approved aggregate outputs from exploratory, single-cohort analyses; the secondary analysis is not an independent replication. Participant-level data and the original pipeline are unavailable, so the reported statistics were not independently reproduced here. Historical labels such as “propagation time” and “optimal IPI” refer to a legacy phase-derived signal-processing proxy and a selected response extremum under a within-sample definition—not measured neural conduction or a validated treatment rule.
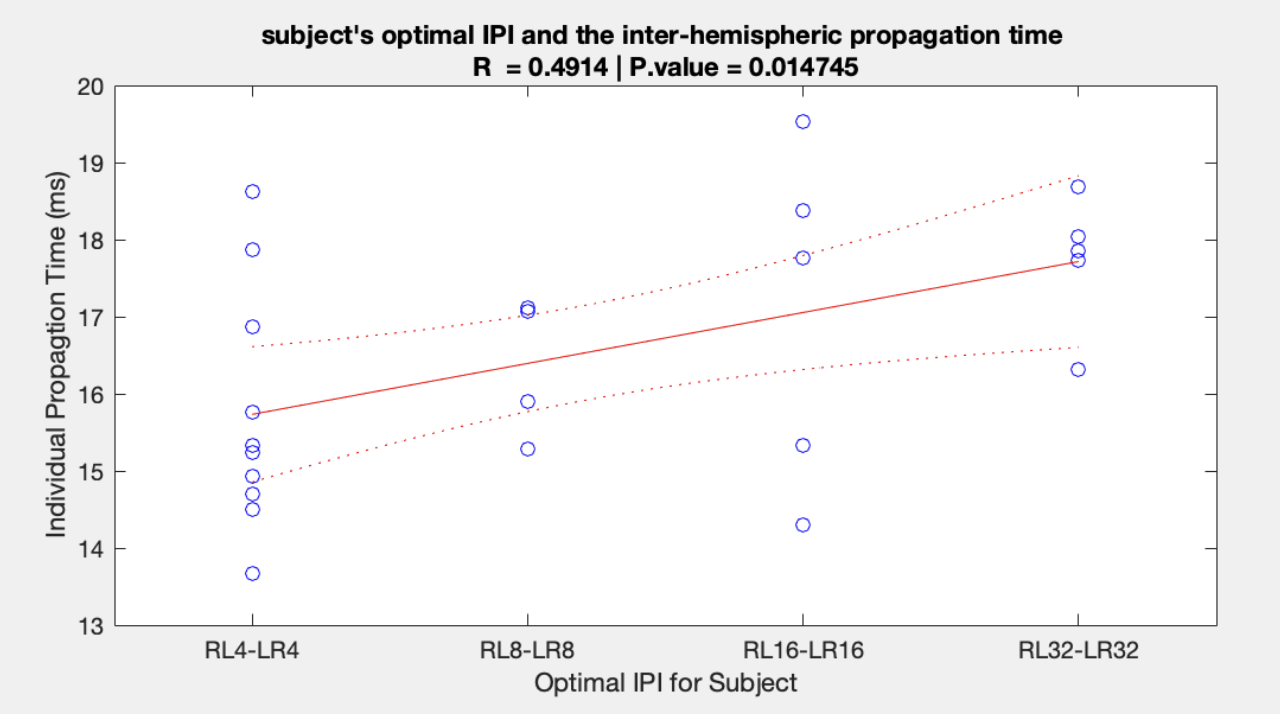
The approved artifact reports R = 0.4914 and p = 0.014745. This is an exploratory, same-cohort fit using ordered IPI categories; it is not a reproduced or prospectively validated result.
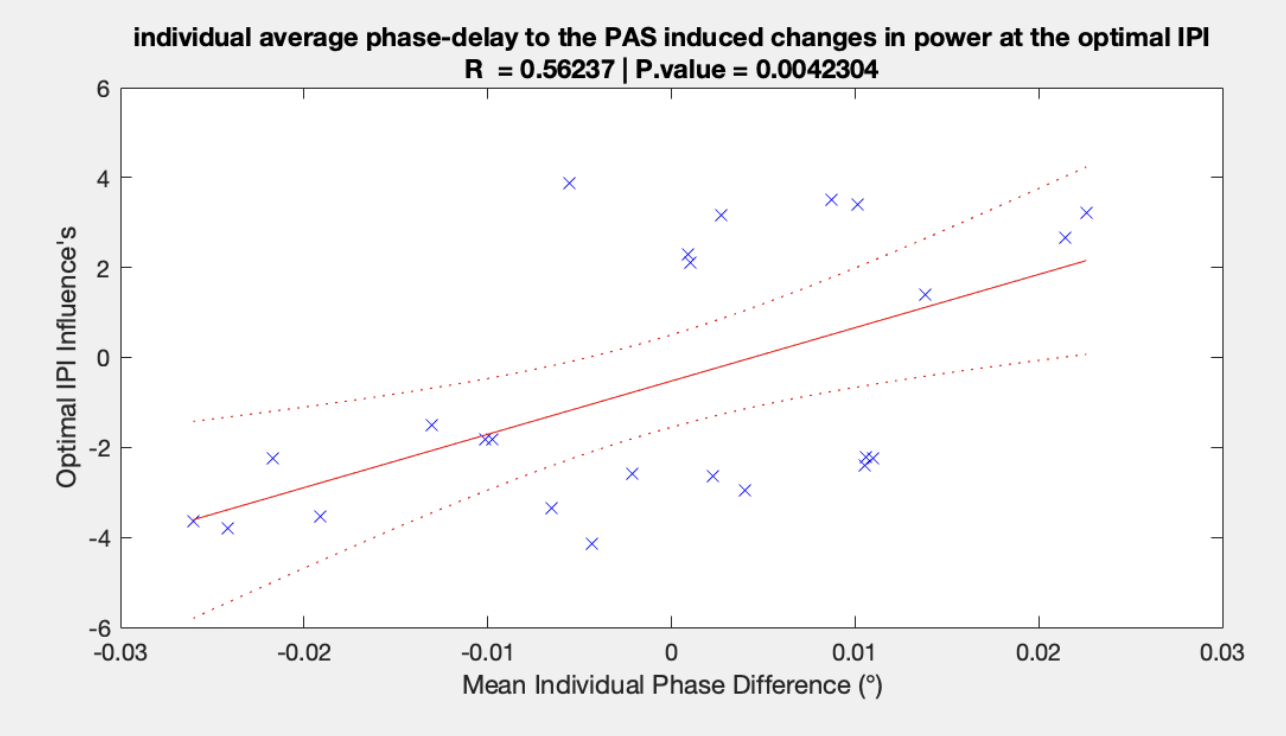
The approved artifact reports R = 0.56237 and p = 0.0042304. It uses the same cohort and related derived variables, so it is a secondary analysis—not independent replication.
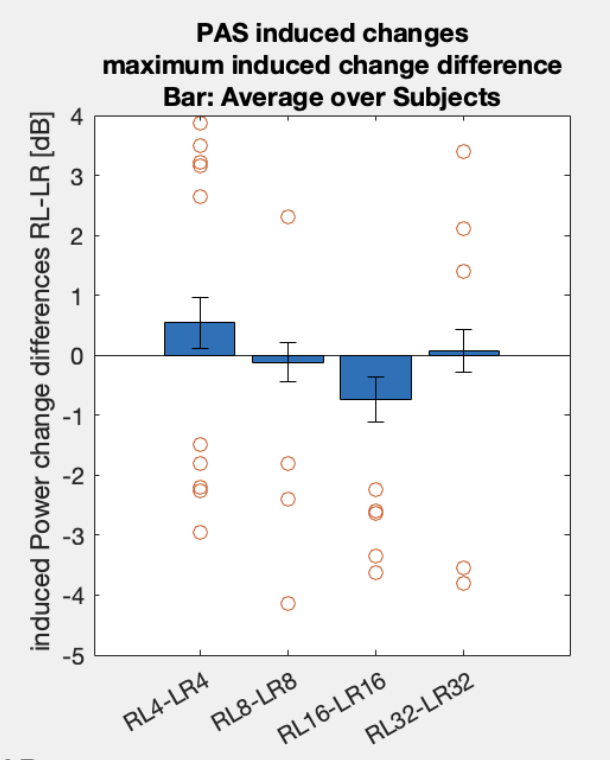
Bars summarize the cohort while points show selected individual extrema. Selection and display are not independent.
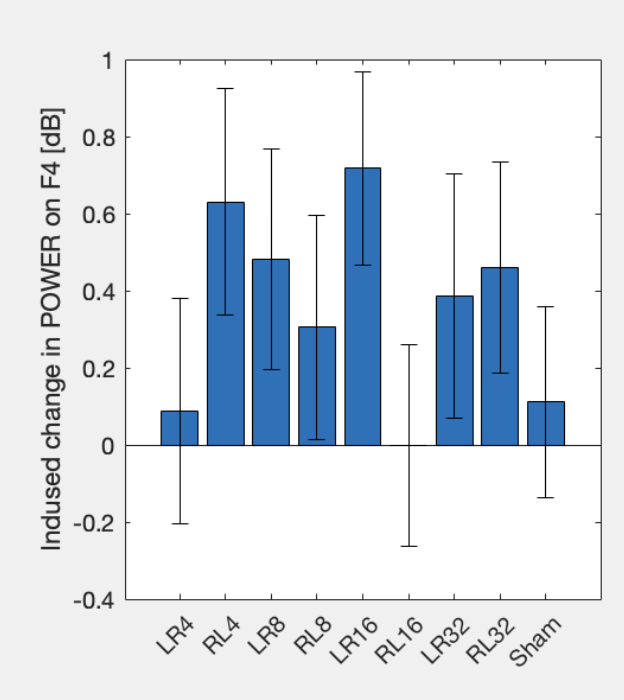
An approved aggregate research visualization. The EEG response shown is not a clinical endpoint or treatment-efficacy measure.
03 · Synthetic technical demo
This separate MATLAB demo creates invented spectra with a known phase delay, then checks that the implementation recovers the expected result, handles angle wrap-around, and rejects invalid inputs. It uses no study data and does not reproduce or validate the historical results above.
addpath("matlab")
phase_lag_demo
View demo source →
addpath("matlab")
results = runtests("tests");
assertSuccess(results)
View test source →